

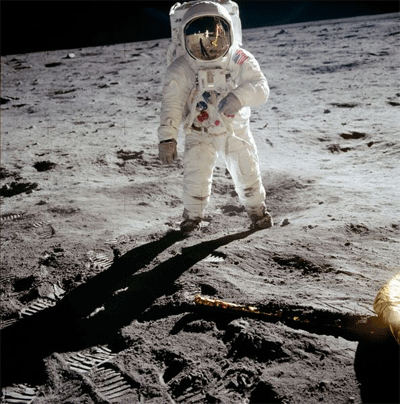
Elling Lien says peeing into a vaccuum cleaner is for astronauts only.
It’s not every day you can go back and rewrite history. But that’s just what an Australian-based computer programmer has done using Newfoundland-made software.
It all has to do with the letter “a”…
July 20, 1969. Neil Armstrong’s first steps on the moon. The first time a human being had ever set foot on another celestial body. He steps off the ladder and says…
“That’s one small step for man, one giant leap for mankind.”
Huh? If you think carefully about what that sentence means, it doesn’t add up. It’s redundant. He might as well have said “That’s one small step for mankind, one giant leap for mankind.”
What Armstrong meant to say, and what he thought he said at the time was the more grammatically apropriate: “That’s one small step for a man, one giant leap for mankind.”
Australia’s Peter Shann Ford always believed Armstrong said the “a” and that we just couldn’t hear it. To prove it, he analyzed audio from the famous quote using sound editing software called GoldWave.
Using the software’s noise filter and graphic tracing, he was able to carefully determine that Armstrong did say “a man” in between the static.
He presented NASA with what he discovered, and they are currently reviewing the information.
GoldWave founder and president Christopher Craig found out last Friday that his software was used for the research. Although he doesn’t deny GoldWave is a powerful program, he says the credit for uncovering the error belongs to Ford.
Whether the change will be accepted is another question.
“I’m optimistic that this is one change historians will accept,” he says. “Hopefully there will be some small mention of how Canadian software helped find the missing “a”, eh?”
WEB EXTRA
I sent Christopher Craig a few questions about GoldWave. Here’s what he said:
What’s your connection to GoldWave?
My name is Christopher Craig (B.Eng). I am the developer of GoldWave and the president/CEO of GoldWave Incorporated. The program was created in 1993 during a work term while I was enrolled in electrical engineering at MUN. It was a way for me to improve my software engineering skills and learn more about digital signal processing.
The first version was finished in April of 1993 and was distributed on the Internet to determine the level of interest for this type of software and the market potential. The program was so popular that I decided to work full time on its development when I graduated the following year. Its success has exceeded my expectation and it continues to thrive today. In fact, searching for “audio software” on Google lists GoldWave as the highest ranked site in the world.
Where are you based in Newfoundland?
The company does not have a central office. It is an Internet based company without the traditional brick-and-mortar physical location. I do most of the work in a home based office located in Middle Cove.
How did you first hear that Peter Shann Ford was attempting to analyze the speech using GoldWave?
Mr. Ford contacted me last week about his analysis, but I only became fully aware of the details last Friday. I have studied his paper and analyzed the recording to verify his conclusion.
Why was GoldWave used and not other software?
The analysis could have been done in other audio software, but GoldWave has a number of advantages. It is easy to find, download, and install. Anyone with a Windows PC can download and start using the program immediately. The program is relatively easy to learn and use, but also contains advanced functionality for professionals. GoldWave was one of the first audio programs to include a general purpose Noise Reduction filter, which was used in Mr. Ford’s analysis. The same filter is being used by the US Coast Guard to eliminate noise on distress call recordings. GoldWave also includes a number of real time graphs for displaying amplitude waveforms, frequency spectrograms, and other visual representations of audio that are useful for analysis.
What is graphic tracing and why did it help?
A graphic tracing is a visual representation of the audio waveform where the waveform amplitudes are plotted on a graph. It looks a bit like a seismogram for earthquakes, but for sound waves instead of seismic waves. These graphs help because they show things we may not be able to feel or hear. In the same way that very minor earthquakes cannot be felt, but still appear on the seismogram, the almost inaudible “a” can be seen in the audio graph of the NASA recording.
How does it feel to have helped (basically) rewrite history?
The credit belongs to Mr. Ford. It was his idea and analysis that revealed the elusive syllable.
History tends to be rather stubborn, but I’m optimistic this is one change historians will accept. Hopefully there will be some small mention of how Canadian software helped find the missing “a”, eh?
Thanks Chris!




The Scope | Wed, Oct 4, 2006 | 130
The Fourth Wall, The Log